More on Mission, Subsidiarity, and Diocesan Operating Budgets

This all got started because I was lobbying the Episcopal Church to fund creation care ministries.
Commenters asked me, “What about subsidiarity? Shouldn’t dioceses be making these decisions and funding them?”
In response, I researched and published the disparity between diocesan operating budgets, particularly as it related to areas of land covered by each diocese. At random, I picked Province I and Province VI, because I had a sense that they would suffice to illustrate my point. They did. In fact, the data was rather shocking. Here’s the chart again in case you missed it:
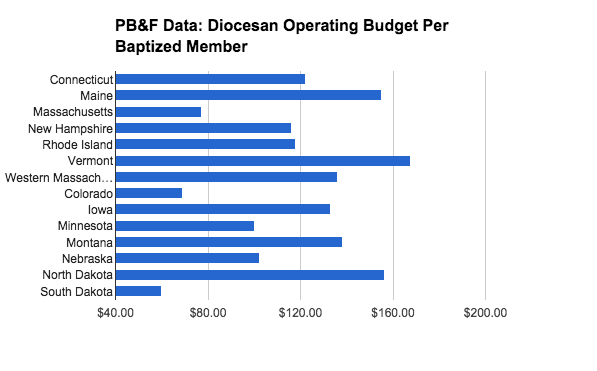
And then readers said, “That’s interesting! And, it would be interesting to know how each diocesan budget was funded per member of the church, and overall population!”
I do like to listen to readers. Except that, even though I received a spreadsheet with every diocesan’s operating revenue in response to the last post (thank you!) I had a sick kid this week and a few other priorities and so these charts are still just Province I and Province VI data. Someday I may be able to do a more comprehensive chart, but that day is still ahead of me.
An important note: Close readers will recognize that the operating budgets listed here are not the same as those listed in the prior post.
For the prior post, I went to each diocesan website and located the budget passed by their diocesan convention. For this post, I took my figures from the Program, Budget, and Finance Committee’s report. Some dioceses receive significant grants from the churchwide budget for mission and ministry, which are not considered part of their operating income by Program, Budget and Finance.
The charts below rely on the data from Program, Budget, and Finance, because I decided that block grants for specialized ministry should not be considered part of the data for the purposes of publishing these charts. Anyone who feels differently, Google Spreadsheets is waiting for you.
Aside from the fact that we all have something to learn from Wyoming (who knew?), what do these charts teach us?
Canon Frank Logue summed it up beautifully in a comment on my Facebook page: “the inequity in size of dioceses by size of budget and endowment when compared to the number of congregations and parishioners changes what a diocese can do through diocesan resources. Some dioceses will be able to do more than others in many areas due to the scale of their budget. So expecting all dioceses to do X needs to factor in that this expectation is being laid equally on Western Kansas and Texas, two dioceses with significant orders of magnitude separating their resources.”
I couldn’t have said it better myself, which is why I’m quoting him.
What do you think? Does this data say anything to you about mission and subsidiarity?
What does the disparity between dioceses mean for our churchwide budget and its purpose?


Member discussion